


Poor airflow can push HVAC energy use up by 20% to 35%. If you fix airflow at the diffuser, duct, and control level, you can often cut fan power first, then trim cooling and heating/reheat use too.
Here’s the short version:
- I see the biggest savings come from static pressure reset and fan speed control
- Duct leakage and airflow imbalance can add 9% to 18% to HVAC cost
- In field studies, airflow fixes cut cooling energy by about 15.1% on average
- Correcting high minimum airflow setpoints can reduce reheat energy by 20% to 40%
- Whole-building commissioning that includes airflow fixes often lands in the 6% to 15% savings range
This also affects more than energy bills. Airflow work helps keep ventilation rates, building pressure, and TAB certification and inspection paperwork in line.
If I had to sum it up in one sentence: <u>proper airflow distribution helps the HVAC system move less air, at lower pressure, with less waste</u>.
| Area | What matters most | Typical result |
|---|---|---|
| Fan energy | Static pressure reset, VFD tuning, terminal airflow correction | Often the first and largest drop |
| Cooling | Fixing imbalance, cutting extra outdoor air, sealing leaks | Lower cooling runtime and load |
| Heating/reheat | Lower VAV minimums, better supply/exhaust balance | Less reheating of extra air |
| Compliance | Outdoor air checks, TAB reports, pressure readings | Better support for closeout and inspection |
The core idea is simple: when supply, return, exhaust, and outdoor air are measured and set correctly, the system stops working harder than it has to.
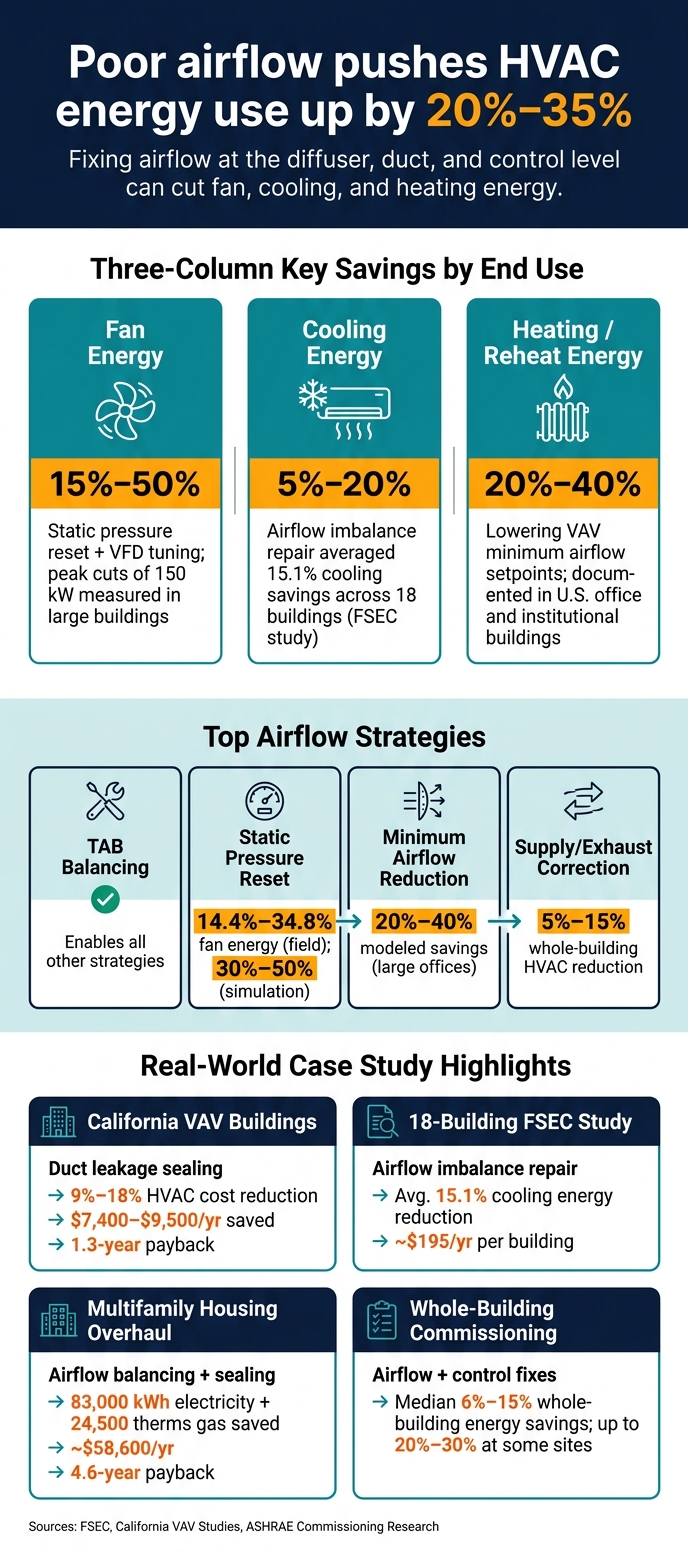
HVAC Energy Savings from Proper Airflow Distribution
The Value of HVAC Air Flow Analysis
What Research Shows About Energy Savings from Correcting Airflow
Research points in a pretty clear direction: when you resolve common airflow issues, fan energy, cooling energy, and total HVAC use go down. The biggest drops tend to show up when teams tune fan control, seal leakage, and bring ventilation rates back to where they should be.
Measured Savings from TAB, Commissioning, and Airflow Corrections
Fan control is often where the largest savings show up first. In one continuous commissioning case, a 13% VFD speed reduction cut fan power by 35%. That lines up with basic fan law behavior. And when buildings move from constant static pressure to static pressure reset, the drop can be much larger. Field case studies and simulations report 50% to 75% annual fan power savings under those setups.
Leakage and airflow imbalance can also burn a lot of energy. California VAV studies found that duct leakage increased annual HVAC costs by 9% to 18%, or about $7,400 to $9,500 per year. Sealing that leakage at $0.20 per square foot of duct surface led to a 1.3-year payback. In large commercial duct systems, getting rid of leakage can save 1 kWh per square foot per year in electricity.
Cooling savings matter too, and they don’t only come from slowing fans down. They also appear when airflow errors are fixed at the system level. In an 18-building Florida Solar Energy Center study, repairs to airflow imbalance helped 17 of 18 sites reduce cooling energy use. The average cooling energy savings came to 15.1%. One case from that same study showed combined AC and exhaust fan energy use fall by 36%, from 39.7 kWh/day to 25.4 kWh/day, with projected annual savings of $2,175.
Across multi-building projects, those gains can add up fast. One analysis saved 166,776 kWh/year through TAB and another 134,956 kWh/year through control upgrades such as VFDs and heat exchangers. A multifamily ventilation overhaul reported 83,000 kWh in annual electricity savings and 24,500 therms in gas savings. That worked out to about $58,600 per year in lower utility costs. The total project cost was near $370,000, with a 4.6-year simple payback after utility incentives.
Case Study Comparison Table
| Building / Project Type | Intervention | Energy Savings | Annual Cost Savings | Payback / Notes |
|---|---|---|---|---|
| 18-building residential study (FSEC) | Airflow imbalance repair | Avg. 15.1% cooling energy reduction | ~$195/year per building | Avg. repair cost ~$455 |
| Individual FSEC case | Exhaust/supply airflow correction | 36% reduction (39.7 → 25.4 kWh/day) | ~$2,175/year | NR |
| California VAV commercial buildings | Duct leakage sealing | 9%–18% HVAC cost reduction | $7,400–$9,500/year | 1.3-year payback |
| Multifamily housing overhaul | Airflow balancing, sealing, ventilation correction | 83,000 kWh electricity + 24,500 therms gas/year | ~$58,600/year | ~4.6 years |
| Multi-building analysis | TAB + VFD and control optimization | ~301,732 kWh/year combined | NR | NR |
| VAV system | Fan static pressure reset via VFD | 25–75% fan power savings | NR | NR |
The next section explains why these savings tend to show up in fan energy first, and then move into cooling and heating loads.
Which Airflow Strategies Cut Energy Use the Most
Not every airflow fix delivers the same payoff. Static pressure reset and variable fan speed control usually save the most. After that, lower minimum airflow setpoints can make a big dent too. The catch is simple: these controls only work well when the airflow numbers behind them are right. That’s where TAB comes in.
The energy savings below come from control changes that TAB helps make dependable.
Static Pressure Reset and Fan Speed Control
Static pressure reset lowers the duct static-pressure setpoint when zone demand drops. That lets a variable-speed supply fan slow down instead of holding a fixed setpoint all day. A lot of VAV systems run with more static pressure than they need, and that burns fan energy for no good reason.
Across five demonstration sites, static pressure reset cut fan energy by 14.4% to 34.8% compared with fixed static pressure operation. A Midwest building study found about 25% fan energy savings over a two-week test period with the same approach. Simulation studies often show 30% to 50% fan energy savings when reset is done well instead of fixed-setpoint control.
TAB-verified terminal cfm matters here. If one zone is getting less air than it should, the BAS may keep static pressure high just to satisfy that problem zone. Fix the airflow at the terminal, and the system can stop overworking the fan.
Minimum Airflow Setpoints and Outdoor Air Control
Many VAV systems use minimum airflow setpoints that are more conservative than the building needs. When those minimums sit above ventilation and comfort needs, the system keeps moving and conditioning extra air whether it helps or not.
Modeling work on large office buildings found that lowering minimum VAV damper flow setpoints can lead to 20% to 40% savings compared with over-specified defaults. A separate NIST study found that a 24-hour reduced-ventilation schedule used 9% less annual energy than the ASHRAE 62.1 prescribed case in retail building models for Atlanta and Chicago.
Of course, this isn’t a free-for-all. Any reduction still has to meet code ventilation rules. TAB checks outdoor-air cfm at intakes and mixing boxes so teams can confirm compliance after setpoint changes.
Strategy Comparison Table
| Strategy | Implementation Method | Key Measured Variables | Typical Savings Range | System Prerequisites |
|---|---|---|---|---|
| TAB balancing | Measure and correct supply, return, exhaust, and outdoor-air flows | cfm, OA/SA/RA balance, damper position | Enables other strategies and helps avoid wasted energy | TAB tools, trained technicians, measurement access |
| Static pressure reset | Lower duct static pressure setpoint based on actual zone demand | in. w.g., fan kW, damper position, airflow | 14.4%–34.8% in demonstrations; about 25% in a field test; 30%–50% in simulations | VFDs, DDC controls, reliable zone sensors |
| Minimum airflow reduction | Reduce VAV minimum damper setpoints where ventilation and comfort allow | cfm, minimum damper %, heating/cooling kWh | 20%–40% modeled savings in large offices | Code-compliant ventilation design, TAB verification |
| Supply/exhaust correction | Rebalance OA, SA, RA, and exhaust to avoid excess ventilation and pressure conflicts | cfm, pressure differentials, OA fraction | Varies by building; can reduce heating and cooling loads from over-ventilation | Accurate airflow measurements, functional dampers |
These control changes cut fan energy first. Then they lower cooling and heating load too.
How Airflow Distribution Affects Fan, Cooling, and Heating Loads
Once airflow is fixed, the energy impact usually shows up in a pretty clear order: fan power first, then cooling and heating loads. And airflow errors rarely stay in one lane. They ripple through the whole HVAC system. High static pressure wastes fan energy, high minimum airflow setpoints drive reheat, and pressure problems pull unwanted outdoor air into the building.
Fan Energy: The Most Direct Path to Savings
Fan power is usually the first place these airflow issues show up. And it tends to show up fast.
When terminal units aren’t balanced, the BAS often responds by keeping duct static pressure higher than it should be just to force air into zones that aren’t getting enough. That sounds like a small control issue, but the energy hit can be big. Even modest airflow increases can push fan energy up hard, especially when one group of zones gets too much air while another group gets too little.
In large buildings, lowering duct static pressure setpoints has delivered measured peak fan power cuts of 150 kW. Across multiple demonstration projects, static pressure reset lowered building-level fan energy by 25% to 59% compared with fixed-setpoint operation.
A common post-renovation problem is uneven air delivery at the diffuser level. Some zones end up getting 20% to 30% more air than they need, while other areas are short on airflow. Fixing that distribution problem is what allows static pressure reset to work the way it should. If terminal cfm data is off, the BAS doesn’t have a solid reason to bring the setpoint down.
And the effect doesn’t stop at the fan. That same imbalance changes coil loads and reheat too.
How Airflow Errors Change Cooling and Heating Load
When VAV boxes are set with minimum airflow values that are too high, zones get more cool supply air than the space calls for. Then the system has to reheat that extra air just to keep people comfortable. That’s wasted energy, plain and simple.
Commissioning and TAB work in U.S. office and institutional buildings has documented reheat energy reductions of 20% to 40% after correcting minimum airflow setpoints and balancing terminal flows.
Supply and exhaust imbalance adds another problem. If exhaust is higher than supply, the building pulls in uncontrolled outdoor air through cracks, gaps, and openings. That extra air adds both cooling and heating load. Bringing supply and exhaust back into line can cut whole-building HVAC energy use by 5% to 15%.
One field demonstration went a step further. Using corrected zone airflow logic – without changing outdoor air volume – the project reported cuts of 41% in heating energy, 23% in cooling energy, and 15% in fan power at the same time.
End-Use Savings Table
| End Use | Typical Savings Range | Typical Reduction | Typical Building Type |
|---|---|---|---|
| Fan energy | 15% to 50% | 50,000 to 150,000 kWh/yr | Mid-size office with VAV AHUs and VFDs |
| Cooling energy | 5% to 20% | 30,000 to 120,000 kWh/yr | Large office or school with significant outdoor air load |
| Heating / reheat energy | 20% to 40% | Tens of thousands of therms or electric equivalent | Hospital, university, or VAV system with high minimum flows |
These ranges come from published commissioning studies and field demonstrations. Actual results depend on how far the current system has drifted from design, what control setup is in place, and how far setpoints are adjusted after balancing. Buildings with VFDs, DDC controls, and high outdoor air demands often see the biggest payback.
Measured savings also vary based on system condition, controls, and how performance is checked, which sets up the next section on research limits and what they mean for TAB projects.
Research Limits and What They Mean for TAB Projects
Those savings are real, but they don’t move neatly from one building to the next. Research shows steady savings from airflow correction, but there isn’t one fixed percentage that fits every job. Results change based on baseline drift, controls, climate, occupancy, and equipment condition. Federal guidance also points out that commissioning often stops losses before they become baked into day-to-day operation, instead of showing up right away as a lower utility bill. For TAB projects, that distinction matters. In many cases, the job is less about chasing an instant drop in cost and more about stopping waste before it turns into the building’s normal state.
That’s also why the study method matters just as much as the savings figure. Some studies use field data. Others use simulation. For TAB work, measured field results carry more weight than modeled estimates. Airflow readings, static pressure measurements, BAS trend logs, and utility bill analysis show what the building is actually doing. Models can still help, but they’re tied to assumptions about weather, schedules, and control behavior. The strongest research spells out the baseline condition, the correction made, and the way short-term monitoring was turned into annual savings. For verification, the literature recommends short-interval energy and demand data collected for at least 3 months, and ideally 6 to 12 months.
For TAB teams, the takeaway is pretty simple: measure first, then correct. Start with measured cfm and static pressure, not nameplate values or rough assumptions, and match those readings against the design documents and the sequence of operations. That’s usually where the real trouble shows up:
- Dampers stuck open
- Minimum airflow setpoints pushed too high
- Fans running at full speed because no static pressure reset strategy was put in place
A building can pass basic functional checks and still carry unresolved airflow imbalance. When that happens, the owner inherits the problem. Over time, that can mean higher fan energy, extra reheat, and comfort complaints that are tough to trace back to the source. Documentation is what makes the work defensible: field readings, deficiency lists, corrective actions, post-correction readings, and a clear explanation that ties the results back to design intent. That same workflow also helps with HVAC compliance for final inspection and occupancy approval through documented testing, reporting, and certification.
Conclusion: What the Research Says About Airflow and Energy Savings
The research points in one direction: fixing airflow problems can cut energy use in a measurable way. When teams correct VAV minimum airflow and static pressure control, HVAC energy use drops. And the biggest drop tends to show up in fan power.
At the building level, existing-building commissioning shows the same pattern. When commissioning includes airflow and control fixes, median whole-building energy savings land in the 6% to 15% range, with some sites reaching 20% to 30%. Those numbers are not a promise for every building. But they do show what can happen when airflow issues are found and fixed instead of ignored.
There isn’t one savings figure that fits every site. Results depend on how far the system has drifted from design, which controls are already in place, and how completely the TAB work is done. The best results tend to come from a mix of fixes: cutting excess airflow, lowering duct static pressure, and tightening minimum outdoor air control, rather than betting on just one change.
The research also makes one point clear: energy savings can’t come at the cost of ventilation compliance. ASHRAE standards reinforce that ventilation airflow must be measured and matched to required rates. TAB documentation helps connect energy-related fixes to ventilation compliance and project closeout.
For contractors, engineers, and building managers, proper airflow is one of the main places where building energy waste is either fixed or left on the table. TAB makes airflow performance visible, correctable, and defensible.
FAQs
How do I know if my building has airflow problems?
Common signs of airflow problems include:
- Uneven temperatures between rooms
- Doors that slam or are hard to close
- High energy bills
- Poor air quality or general discomfort
- Clogged filters, duct leaks, or fans that aren’t doing their job
Put simply, these signs often mean the system isn’t working the way it was designed to. The only way to know what’s wrong is to test it with professional equipment.
What HVAC systems benefit most from TAB airflow corrections?
TAB airflow corrections help most in complex HVAC systems, especially in new construction and major retrofits where all the parts need to work together with tight control.
They also matter a lot in critical settings like hospitals, cleanrooms, and biosafety labs. The same goes for systems with uneven airflow, comfort complaints, fan speeds that are too high, or duct leakage.
How long does it take to verify energy savings after airflow fixes?
Verification happens immediately during fine-tuning. As technicians adjust dampers, fan speeds, and control settings, they check on-site that the system is hitting its design targets.
After that, a certified TAB professional prepares a report that documents the verified improvements. Air Balance Masters delivers final reports within 48 hours for project documentation and approvals.


