


Machine learning can spot HVAC trouble before shutdown by reading sensor patterns, not just alarm limits. In commercial buildings, that can mean fewer emergency calls, lower repair spend, and less downtime. One deployment tied predictive monitoring to a 33% drop in maintenance costs and an 18% drop in HVAC energy costs.
Here’s the short version:
- I start with clean BAS/BMS sensor data
- I make sure the system baseline reflects correct airflow, pressure, and temperature
- I match the model to the job:
- Random Forest for labeled fault history
- Autoencoders when labeled faults are thin
- LSTM or time-series regression when I need failure timing
- I send alerts into the CMMS as draft work orders
- I use guardrails like 12–24 hour persistence and multi-signal checks to cut false alarms
This article shows a simple path: build the data set, train the right model, and connect alerts to maintenance work. It also makes one point clear: if the HVAC system is not balanced and verified first, the model can learn bad “normal” behavior and miss faults later.
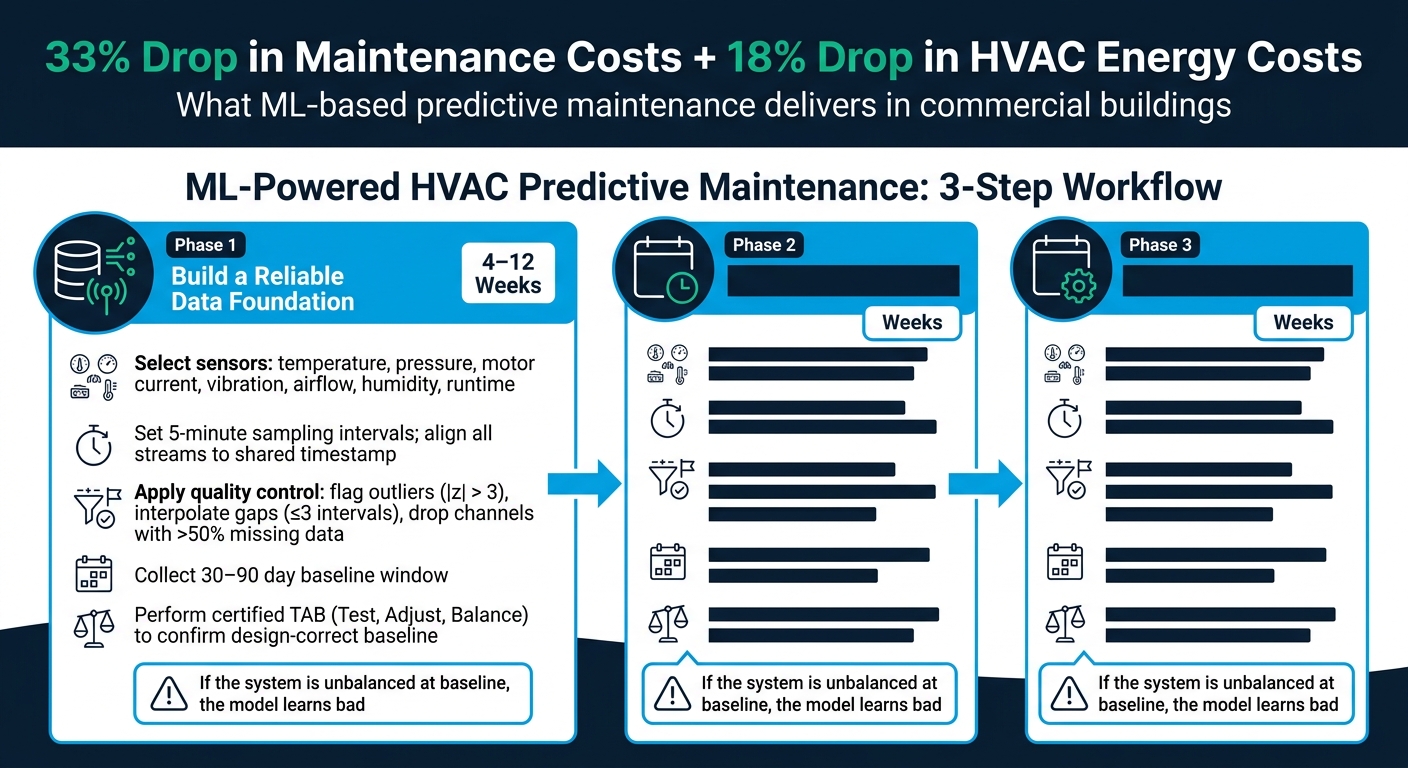
ML-Powered HVAC Predictive Maintenance: 3-Step Implementation Workflow
What Is AI-Driven Predictive Maintenance? HVAC, Refrigeration & MEP Explained
Step 1: Build a Reliable HVAC Data Foundation
Once alerts move past fixed thresholds, the next move is data the model can actually trust. Before any ML system can predict failures, it needs HVAC data that is clean, time-aligned, and representative of how the system runs day to day.
Choose the Right Sensors for Common HVAC Failure Modes
Most HVAC faults don’t show up as one sensor crossing one limit. They usually appear as a pattern across several points. Bearing wear, coil fouling, and a stuck damper each leave their own fingerprint across multiple readings. That’s a big reason ML-based fault detection works so well in HVAC.
A practical minimum sensor set should cover the failure modes you’re most likely to see across air handlers, rooftop units, chillers, and VAV systems:
| Sensor Type | Installation Point | Detectable Failure Modes | Common Data-Quality Issues |
|---|---|---|---|
| Supply / Return Air Temperature | AHU, VAV boxes | Coil issues, poor heating/cooling performance, mixed-air problems | Improper placement, calibration drift |
| Static Pressure | Ductwork, AHU | Fan degradation, duct restrictions, VAV control problems | Sensor drift, clogged sensing tubes |
| Filter Differential Pressure | Air handlers | Clogged or loaded filters, reduced airflow | Clogged sensing tubes |
| Motor Current | Fans, compressors, motors | Mechanical strain, bearing wear | Current-scaling drift or meter error |
| Vibration | Rotating equipment | Bearing defects, belt wear, imbalance | Signal noise, mounting issues |
| Airflow / Fan Speed | Ducts, AHU | Fan degradation, blocked filters, VAV issues | Inaccurate readings from poor probe placement |
| Valve / Damper Position | Economizers, VAV boxes | Actuator faults, control hunting, stuck components | Mechanical binding, latency |
| Humidity | Return air, conditioned zones | Dehumidification failures, latent load issues | Sensor saturation in high-moisture areas |
| Runtime Status | All major equipment | Abnormal operating states, start/stop anomalies | Timestamp gaps, logging errors |
The key is simple: match sensor coverage to the faults that are most likely in your building. Even good sensors won’t help much if timestamps drift, calibration slips, or sampling varies from point to point.
Clean, Align, and Validate Data Before Training Any Model
Raw HVAC data is almost never ready for a model straight out of the BAS. It needs cleanup and alignment first.
Start with the sampling interval. A 5-minute interval is a common default for HVAC process points. It gives enough detail for diagnostics without becoming a storage headache. After that, resample every data stream to the same time grid and build a shared timestamp index so readings from the same moment line up.
Next comes basic quality control. Flag outliers with z-score thresholds; points where |z| > 3 are often treated as invalid. Interpolate short gaps, with up to three consecutive intervals working well in practice, and then use forward fill or backward fill as needed. If a channel has more than 50% missing data, or only one unique value, drop it. At that point, it’s adding noise, not signal.
The baseline window matters too. In most cases, a 30- to 90-day baseline works well. If your building has strong seasonal swings, use the longer end of that range.
Then comes feature engineering, where raw point values turn into signals a model can use. Rolling averages help smooth noise. Rate-of-change metrics help catch slow drift. Residuals – the gap between what a sensor reads and what it should read – are especially useful for spotting gradual degradation before it turns into a threshold alarm. A slow climb in filter differential pressure, for example, can hint at a coming blockage before the alarm ever trips.
After preprocessing, TAB helps confirm that the baseline reflects design intent rather than startup mistakes or setup errors.
Use TAB Results to Improve Baseline Accuracy
There’s an easy trap here. If the system has design flaws, poor commissioning, or bad setpoints when you collect baseline data, the model can learn those conditions as “normal.” When that happens, it may miss actual faults or flag normal corrections as anomalies.
Test, Adjust, and Balance (TAB) sets a design-correct baseline before model training begins. For contractors and facility teams, certified TAB checks airflow issues, static pressure, and temperature differentials before baseline capture. That way, the model learns from operation that matches design intent. Air Balance Masters provides certified air balance testing, deficiency reporting, and certification services that support this starting point.
Step 2: Choose the Right Machine Learning Method for the Failure You Want to Predict
Once your data is clean and your baseline is in place, the next move is simple: match the model to the fault and the data you actually have. The goal isn’t to chase the most advanced model. It’s to pick the simplest one that turns BAS data into a repair call.
Use Supervised Models When Historical Fault Labels Are Available
If your BAS logs or building maintenance records include labeled fault events – like fan degradation, compressor short cycling, low refrigerant charge, or sensor drift – you’re in good shape for supervised learning. These models learn the difference between normal conditions and fault conditions by studying past labeled examples.
For tabular BAS data, Random Forest is often a smart place to start. It works well in practice and gives technicians feature-importance scores they can actually use. SVM fits smaller datasets where fault classes are clearly separated. Neural networks make more sense when you have larger datasets and more nonlinear patterns.
Use Anomaly Detection When Fault History Is Limited
If fault labels are missing or thin, shift from classification to anomaly detection.
Use anomaly detection when labeled fault history is limited. Autoencoders are trained on verified normal-operation periods. After training, the autoencoder tries to reconstruct incoming sensor data. If reconstruction error jumps high, the system flags it, because the current pattern no longer looks like the learned baseline. This is especially helpful for catching faults you haven’t seen before, where labeled examples don’t exist but the sensor behavior plainly drifts away from normal.
Clustering methods like k-means or DBSCAN group past data into common operating states, such as economizer mode or low-load nighttime operation. Data points far from those clusters become candidate faults. Over time, technicians can confirm which anomalies were actual faults. Those confirmed events can then feed a supervised model later on.
Use Time-Series Models to Estimate Failure Timing and Remaining Useful Life
If the goal isn’t just detection but timing, move to time-series forecasting.
Anomaly detection tells you something is wrong. Time-series models tell you when it’s likely to fail. That difference matters because it gives teams room to schedule service before the unit goes down.
LSTM networks work well for gradual trends: slowly rising compressor current under the same cooling load, a steady drop in heat exchanger temperature differential, or fan vibration that keeps climbing week after week. Time-series regression models such as ARIMA or gradient-boosted regression on lagged features can estimate when a specific variable – bearing temperature, fan power at a given airflow, or coil pressure drop – will cross a maintenance threshold.
These models matter most for critical assets like large rooftop units, chillers, or AHUs serving mission-critical spaces, where unplanned downtime can trigger emergency service calls costing $500 to $1,500 per incident or more in downtime losses.
A practical rule of thumb:
- Use Random Forest for labeled fault classification
- Use autoencoders for unlabeled assets
- Use LSTM or time-series regression when failure timing matters
Step 3: Deploy a Predictive Maintenance Workflow Your Team Can Use
Picking the right model isn’t enough. You need to send its output into work orders technicians can use.
Follow a Step-by-Step Sequence from Asset Audit to Live Alerts
Once you’ve picked the model, the next job is turning those predictions into a workflow the operations team can run day to day.
Start with a criticality ranking for every HVAC asset on site: AHUs, RTUs, chillers, VAV boxes, and exhaust fans. Score each asset based on occupant impact, safety/compliance risk, and downtime cost. That ranking shows where to start and where a missed fault will cost you the most.
Then move through the process in sequence:
- Rank assets
- Verify the BMS points that drive alerts, and calibrate or add missing sensors before training
- Collect 4–12 weeks of trend data before labeling faults
- Label known fault periods using historical CMMS work orders and technician notes
- Train your chosen model
- Run a 4–8 week alert-validation period before automatic work orders
Once alerts prove reliable, connect model outputs to your CMMS through an API. Each validated fault should create a draft work order with the asset ID, fault type, recommended action, and priority level already filled in. That way, repairs can happen before a shutdown.
Measure Model Performance and Cut False Alarms
After alerts go live, check whether they’re finding faults without burying technicians in noise.
Track precision, recall, F1, and AUC to judge alert quality. Low precision means technicians spend time on "no issue found" visits, and trust drops fast. Low recall means failures still get through. F1 gives you one score that balances both, which helps when you’re reporting up to management. AUC shows how well the model separates fault behavior from normal behavior; higher AUC is better, especially for critical assets.
In busy facilities, it can make sense to accept a bit lower precision on high-risk assets like operating rooms, pharmacies, and data centers so recall stays very high. For comfort-only zones, lean toward higher precision to protect labor budgets.
Use a couple of guardrails before opening a work order:
- Require anomalies to persist for 12–24 hours
- Require multi-signal confirmation
For example, a fouled coil alert should combine abnormal temperature differential, elevated fan energy, and reduced airflow relative to design cfm, not just one temperature reading that drifts out of range.
Plan Timelines, Inputs, and Common Implementation Risks
Use three phases: data foundation, model training, and deployment. The table below maps each phase to the inputs and risks that matter most.
| Project Phase | Typical Duration | Key Inputs | Common Pitfalls |
|---|---|---|---|
| Data Foundation | 4–12 weeks | BMS trends (5–15 min intervals), sensor calibration records, TAB reports, asset inventory | Poor sensor calibration, missing BMS points, inconsistent units, baseline window shorter than 4 weeks |
| Model Training | 4–8 weeks | Labeled fault history, CMMS work-order logs, technician notes, controls integration support | Thin fault labels, data imbalance between fault and normal periods, overfitting to a single season |
| Deployment | 8–16 weeks (pilot + rollout) | CMMS integration, alert-handling SOPs, technician training | High false alarm rate, unclear alert ownership, model drift not monitored, sensor health not tracked |
Timestamps need to match local time and account for daylight saving transitions. If they don’t, the model can misread occupancy patterns and flag normal behavior as an anomaly. Keep timestamps and units consistent across the full pipeline.
Air Balance Masters can provide certified air balance reports to verify airflow and temperature baselines. Those reports can also be attached in the CMMS during alert review.
Conclusion: Combine Machine Learning with Certified Air Balance for Better HVAC Reliability
Machine learning can flag HVAC problems before a unit fails by finding fault patterns in sensor data. But the model only works as well as the data behind it. Clean sensor readings, checked baselines, and the right algorithm for each fault type are what separate useful alerts from background noise.
Here’s the key point: a properly balanced system gives you better training data and fewer false alerts. When airflow, temperatures, and pressures line up with design specs, the model gets a clear picture of normal operation. That makes it much easier to catch an issue early, like a fan bearing starting to wear down or a coil beginning to foul.
Next Steps for Contractors and Facility Teams
Once the model is trained, the next move is simple: turn alerts into maintenance work.
Start with the actions you can take in the next 30–90 days:
- Rank critical assets based on occupant impact and downtime cost
- Verify existing BMS points
- Fix missing or uncalibrated sensors
- Collect baseline data
Certified TAB helps connect model training to actual building conditions. Schedule certified air balance testing before training any model. TAB reports confirm design intent and point out deficiencies that would otherwise skew the baseline.
How Certified Air Balance Supports Long-Term Predictive Maintenance
That checked baseline is what helps predictive maintenance stay accurate over time. Air Balance Masters provides air balance testing, deficiency reporting, and certification for HVAC and general contractors. Their certified TAB reports document baseline values against design specifications, which helps improve model accuracy, cut false alarms, and keep failure prediction dependable over the long term.
For contractors working toward final inspection approvals and certificates of occupancy, that documentation also helps with compliance and project closeout.
FAQs
What data does ML need to predict HVAC failures?
ML works best when it pulls from both historical records and real-time sensor data. That usually includes temperature, humidity, pressure, vibration, and equipment performance.
It can also factor in weather and occupancy trends to spot patterns that might otherwise slip by. For better accuracy, models compare incoming data against design benchmarks like airflow (CFM), static pressure (in. wg), and hydronic flow (GPM).
That comparison helps teams predict failures 30 to 90 days in advance.
Why does air balancing matter before model training?
Air balancing matters before model training because it sets a dependable baseline for predictive analytics. Testing, Adjusting, and Balancing (TAB) makes sure the HVAC system is physically balanced, with the right airflow delivered to each space and the original design targets met.
Without that baseline, a model can end up learning from bad system behavior and produce off-target forecasts. TAB gives you a documented starting point, so monitoring can spot future drift instead of confusing it with installation problems that were there from day one.
How can teams reduce false HVAC alerts?
Teams can cut false HVAC alerts by keeping sensors and control systems properly calibrated. When calibration drifts, the system can flag issues that aren’t there, which leads to alerts no one needed in the first place.
It also helps to simulate alarms on a regular basis, review performance records and data logs, and stick to preventive maintenance with high-quality, calibrated tools. That gives teams a clearer picture of how the system responds, helps separate actual faults from sensor drift, and cuts down on both human and system errors.


